Making Progress On My Program
Well, I am happy with this progress. Twenty-eight days on a Keto (ish) diet, I eat lots of protein and green vegetables. Today someone asked how I get enough protein as I try to eat 220 grams daily. (Today, I ate 260, which is on the high side.) It is not easy. A hamburger patty or some lean chicken for lunch and then a batch of meat and veges in the evening. I usually skip breakfast. This is called Intermittent Fasting, and I find it works well. I drink a large cup of coffee in the AM sweetened with a few drops of stevia, and every few days, I add two tablespoons of organic cream as a treat.
Take a look at the graphs below compared to previous ones. Or look below.
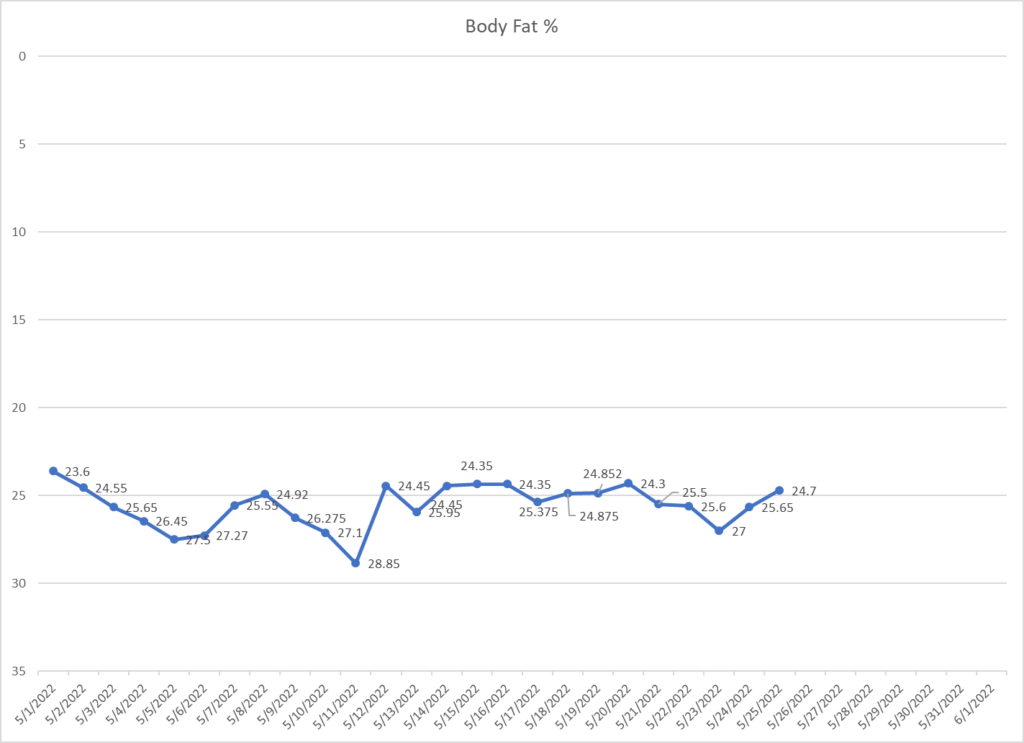
Body Fat Percentage
It has stayed roughly in the same range but is at the lower end. Remember, on a graph like this (a reverse graph), the smaller number is better, so the more considerable number is at the bottom. Reducing body fat percentage is usually the goal of a weight loss diet.
Mine has gone up and down, but I am at the lower range. I used to be in the 30% range, which was not healthy. Body fat percentage is essential. You want it to go down without losing any lean tissue. It is easy to gain fat but very hard to acquire, or even keep, muscle when on a diet. So my body fat % is in the lower range. Good so far.
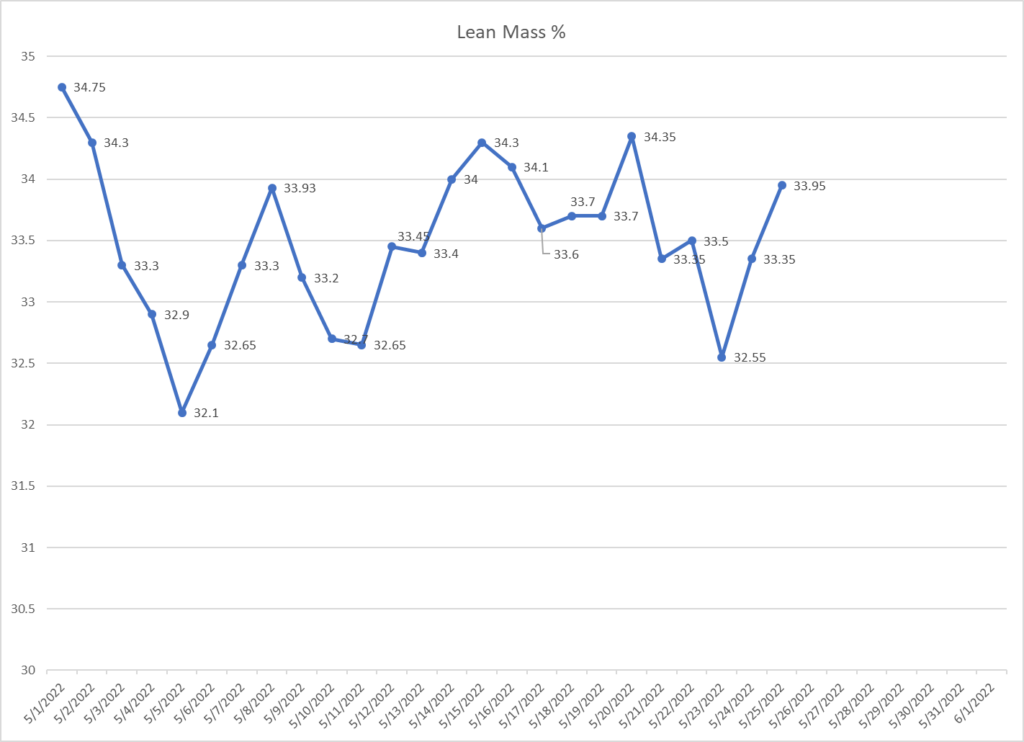
Lean Mass Graph Above
Lean mass (muscle, bone, tendons) has again fluctuated. I will mention again that when one is on a Keto, and sometimes on ANY strict diet, there will be massive changes in body fat and lean tissue numbers. This is called “remodeling” by some in the field of health, weight loss and muscle building. This remodeling is your body coming to terms with a healthier diet.
Carbs and excess calories are THE WHY behind weight gain. More protein and less stored fat and near-zero (25-75 grams a day) of carbohydrates is one of the ways to lose weight and not feel deprived.
A Side Note
One of the sad parts of most diets is that they contain too many refined carbs and even outright sugar. Carbs elevate insulin which tries to store sugar in the muscles but they are always full because Americans eat so much sugar. So the sugar floats around in your blood stream (high blood sugar). Your body wants to restore balance so it takes the sugar in the blood and stores it as fat around your organs. This is very unhealthy. When it can store no more there it builds fat.
Sorry for the distraction. Anyway, for those that are interested I eat a lot of protein and am almost never hungry even though I am eating less calories than my body needs so I am losing weight. A little in the form of fat and some smaller amount of muscle.
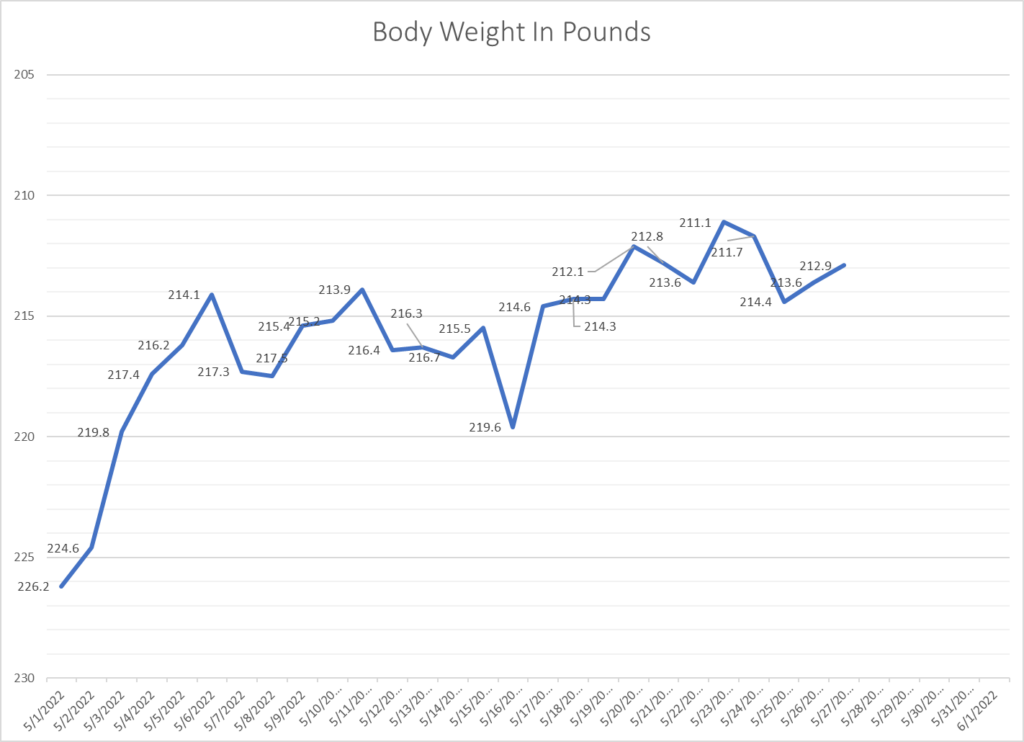
The Weight Graph and Some Moderate Success
I do about 40 minutes a week of very high intensity exercise and this tells my body/brain, “Don’t burn muscle for energy. This guy needs strength.” Which is why I am losing weight, but staying strong and holding onto my muscle/lean tissue.
On to the good part below.
Add Your Heading Text Here
As you can see I started around 226 pounds and 28 days later am at 213, plus or minus. There is lots of variation in the weeks but the overall TREND is what counts. My muscle is staying about the same as a percentage and my weight is dropping. My total body fat percentage is settling around the low range and I expect it to decrease more in the coming month. The body takes around six weeks to get used to any major change in food intake or exercise increase.
I am please, so far with the success of my efforts.
More to come! Leo Hamel
